UK’s Largest Immigrant Communities by Region
UK’s Largest Immigrant Communities by Region: A Detailed Analysis
Introduction to UK Immigration Demographics
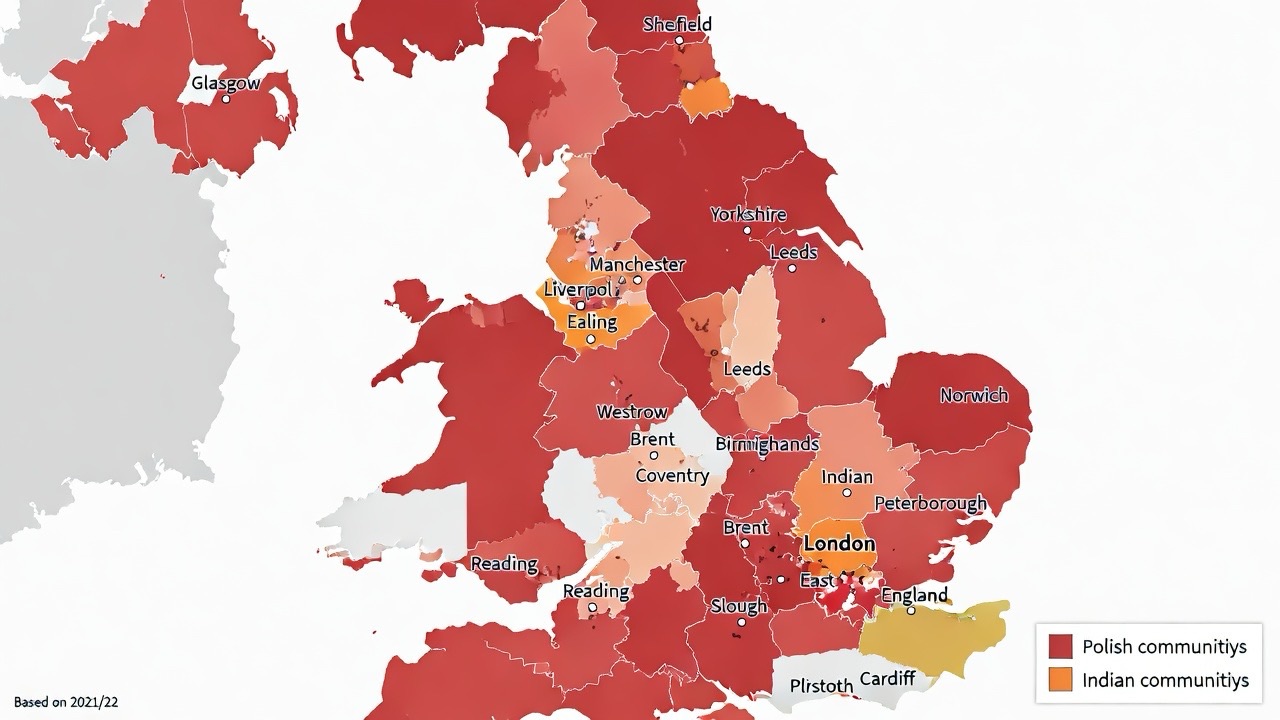
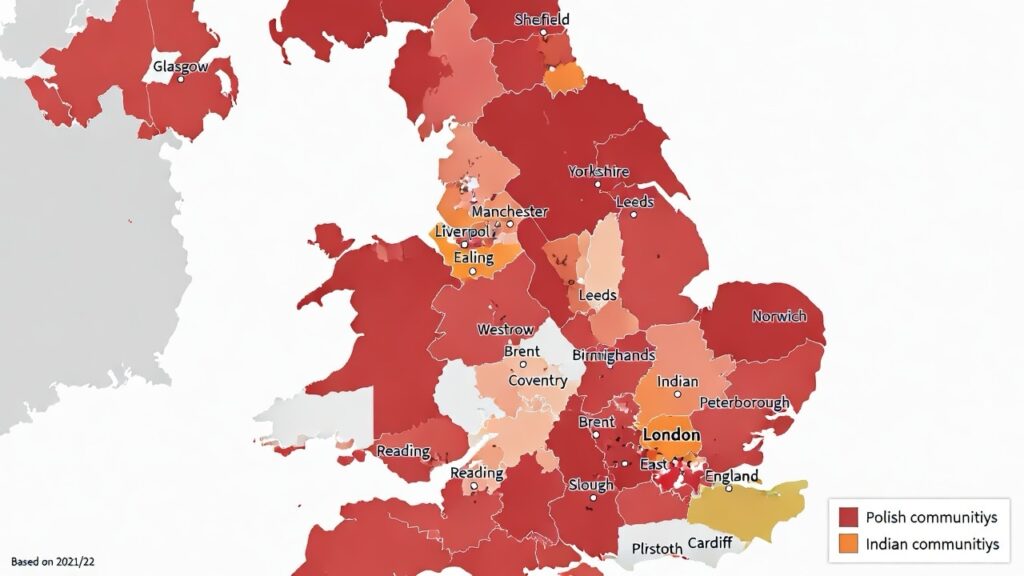
The United Kingdom’s demographic landscape has been shaped significantly by immigration over the decades, creating a diverse and multicultural society. A striking visualization of this diversity is a map titled “UK’s Largest Immigrant Communities By Region,” produced by Nazar x The World in Maps in collaboration with Oxford University. This map illustrates the predominant immigrant groups across various UK regions, primarily highlighting communities from Poland and India through color-coded flags. Regions dominated by Polish immigrants are shaded in red and white, while those with Indian immigrants as the largest group feature the orange, white, and green tricolor with the Ashoka Chakra.
According to the 2021 Census data for England and Wales, approximately one in six usual residents (16.8%, or 10 million people) were born outside the UK, marking an increase from 13.4% in 2011. 1 This growth reflects broader trends in global migration, influenced by factors like EU expansion, economic opportunities, and family reunification. Overall, India remains the most common non-UK country of birth with around 920,000 residents, followed closely by Poland (743,000) and Pakistan (624,000). 17 Similar patterns are observed in Scotland’s 2022 Census and Northern Ireland’s 2021 Census, where Poland and India also feature prominently among immigrant populations.
This article explores these trends in detail, drawing on the latest census data to provide insights into regional variations. Understanding these communities is essential for policymakers, businesses, and society to foster integration and address challenges like housing, employment, and cultural cohesion.
Key UK Immigration Statistics from Recent Censuses
The UK’s foreign-born population has grown steadily, reaching about 16% of the total population by 2021/22. 0 Here’s a breakdown of the top non-UK countries of birth across the UK:
- India: 965,000 people (top overall, particularly strong in urban areas). 5
- Poland: 841,000 people (dominant in many rural and regional areas due to post-2004 EU accession migration). 5
- Pakistan: Significant presence, especially in the North West and Midlands.
- Romania: Rapid growth (576% increase from 2011 to 2021 in England and Wales), reaching 539,000. 8
- Ireland: 325,000, though declining due to aging populations and emigration patterns. 8
Migrants are disproportionately concentrated in certain areas. For instance, London and the South East house nearly half (47%) of all foreign-born residents, despite comprising only a fraction of the UK’s total population. 0 In contrast, regions like the North East and Wales have much lower proportions (around 7%). 1 This uneven distribution highlights how economic hubs attract more immigrants, while rural areas see specific groups like Poles filling labor shortages in agriculture and manufacturing.
The 2021/22 data also shows that 32% of foreign-born residents hail from just five countries: India (9%), Poland (8%), Pakistan (6%), Romania (5%), and Ireland (4%). 0 These figures underscore the impact of historical ties (e.g., Commonwealth nations) and recent policy changes (e.g., EU freedom of movement).
Regional Breakdown of Largest Immigrant Communities
The map effectively captures regional dominance by Polish and Indian communities, aligning with census findings. Below is a detailed regional analysis based on 2021/22 census data, focusing on the top non-UK born groups where available.
London
London stands out as the UK’s immigration epicenter, with over 40% of residents born abroad. 1 The largest group is from India (323,000), followed by Romania (176,000) and Poland (149,000). 6 This reflects London’s role as a global financial and tech hub, attracting skilled professionals from South Asia. The map shades much of London and surrounding areas in Indian flag colors, confirming India’s prominence.
South East England
Similar to London, the South East has a high migrant concentration (around 17% foreign-born). 2 India and Poland are key players here, with the region hosting many commuters and professionals. Cities like Reading and Slough have seen significant Indian inflows, aligning with the map’s tricolor shading in parts of this area.
East of England
This region has experienced rapid migrant growth, with foreign-born residents at about 16%. 9 Poland is often the top group in rural areas due to agricultural work, but urban centers like Cambridge show diverse origins, including India (with an 8.6% increase in foreign-born share from 2011). 4 The map depicts mixed shading, with Indian influences in the south.
West Midlands
Home to cities like Birmingham, the West Midlands has a 23% ethnic minority population. 9 Pakistan and India dominate, but Poland is significant in manufacturing hubs. The map shows Indian flag patterns in central areas, supported by census data showing strong South Asian communities.
East Midlands
Foreign-born residents make up about 18% here. 9 Poland is prominent in places like Northampton and Peterborough, where EU migrants have boosted the economy. However, Indian communities are growing, as indicated by the map’s tricolor in some sub-regions.
North West England
With 15% foreign-born, this region includes diverse cities like Manchester. 9 Pakistan and India lead in urban areas, while Poland is common in rural Lancashire. The map primarily uses Polish colors, reflecting post-2004 migration waves.
Yorkshire and the Humber
Around 15% foreign-born, with Poland and Pakistan as top groups. 9 The map shows a mix, but Polish dominance in northern parts aligns with labor market needs in agriculture and logistics.
South West England
Lower immigration at 10% foreign-born. 9 Poland is the largest group, particularly in Cornwall and Devon, where seasonal work attracts EU migrants. The map shades this region in red and white.
North East England
The least diverse region, with only 7% foreign-born. 1 Poland and India are emerging, but numbers are small. The map indicates Indian influence in urban Tyneside, though overall Polish communities may edge out.
Wales
Poland is the top non-UK born group (24,832 people, 0.8% of residents), with Romania showing rapid growth. 25 Cardiff has higher diversity (16.5% non-UK born), but rural areas favor Poles. The map fully shades Wales in Polish colors.
Scotland
In the 2022 Census, 10% of residents (554,900) were born outside the UK, with Poland topping the list (75,400), followed by India (37,700) and Pakistan (28,900). 30 The map depicts Scotland in Polish red and white, consistent with migration driven by EU accession.
Northern Ireland
Around 6.5% born outside the UK and Ireland (124,000 people), with Poland leading (22,335), then Lithuania (10,451), India (6,908), and Romania (6,612). 36 The map shows Polish shading, reflecting post-Brexit shifts but pre-2021 dominance.
The Role of Polish and Indian Communities in the UK
Polish immigrants, largely arriving after Poland’s 2004 EU entry, have integrated into regional economies, filling gaps in construction, hospitality, and farming. Indian communities, bolstered by historical ties and recent skilled worker visas, contribute to tech, healthcare, and business sectors. Both groups enrich UK culture, from Polish delis in the North to Indian festivals in London.
Implications for UK Society and Policy
This regional diversity brings economic benefits but also challenges like strain on public services. Post-Brexit policies have shifted focus from EU to global migration, potentially altering future maps. As the UK approaches its next census in 2031, monitoring these trends will be crucial.
Conclusion
The map provides a compelling snapshot of UK’s immigrant mosaic, dominated by Polish and Indian communities. Backed by 2021/22 census data, it highlights how migration shapes regions differently. For more on UK immigration statistics, explore resources from the Office for National Statistics or Migration Observatory.